Last Signal: 12/22/00, BUY
Dow: 10,35.56 OTC: 2517.02
The ratio pushed nominally high enough to trigger a SHORT Term trading buy signal, indicating the rally would continue, but not from an oversold enough level to be sustained for the longer term. We think that if this is the continuation of the seasonally bullish period, it will be much better for the many beaten down small issues that will have better recovery prospects as the last of the year end tax selling gives way to re-positioning in the new year. The Ratio is so neutral it can literally go either way, but with our short term indicators bullish, the odds are for moderately higher prices.
FRIDAY, January 5, 2001: WOWEEE!!!!!! What a difference the Fed makes!! While they didn’t make in to UPS in time for Christmas, they did manage to ship the markets their Christmas tidings quickly in the New Year…in a VERY large package…in what appeared to us to be a clear act of PANIC!!! This was discussed in detail in the December issue of Reality Check. We think they may be willing to sacrifice the strength of the US Dollar, but it will likely take quite a long time before the economy shows the benefits gained from their change of policy. For them to have made such a large, pre-emptive move in between FOMC meetings is as clear of a sign of their concern as they could have telegraphed. We wonder which part of the economy they hope to stimulate; the WAY over-indebted, shopping addicted consumer, or way over-indebted corporate America who has lost a large part of their ability to raise capital through debt, because their perceived credit worthiness has been ratcheted lower. We do not expect lower interest rates to re-ignite their haphazard spending and borrowing that, until recently, had fueled the economy to the brink.
Literally, at the blink of an eye, upon the Fed’s surprising announcement at 1:13 pm on Wednesday afternoon, the Dow turned around from a roughly 60 point loss to almost a 400 point reversal, leaving the masses without a chance to "get in" on the news. Heavy short covering was evident and the day ended with record trading volume, the best daily A/D ratio in months, immediate euphoria from an already over-optimistic level of investor sentiment and the biggest one day gain in history. The fact that it is not likely to do much to help the plunging economy was not a consideration. TV’s most bullish talking heads were so bold as to show bears heading back into their caves to "go back into hibernation". We say, the market’s have found a great reason for relief, but we should be alert to the resumption of selling as the jubilation turns back to reality! Even if the worst is truly over, a consolidation was already due before the news, and is now way OVER DUE. We are looking at many trading candidates on both sides of the market, and hope to continue to make our recommendations when we think it appropriate.
We do see some technical problems developing into the strength. For one, yesterdays lower consolidation was on even bigger record volume of better than 2.1 BILLION shares on the NYSE. Higher volume with lower prices is the classic definition of churning, which is a sign of a rally’s termination. While the Transports have gone through the roof, breaking out above our long standing Fibonnacci and price resistance between 2970 and 3030, the Dow remains far short of confirming a new Dow Theory buy signal, where it still needs to close above 11,425 to confirm. This too is the classic definition of a non-confirmation. The defensive utilities, pharmaceuticals and many energy stocks have literally shown signs of collapsing while investors have quickly jumped back on the same depressed high flyers that they were screwed on in the first place! We remain most concerned that even at the worst of the selloff, investor’s sentiment is still much closer to looking like it would at the peak of a bull market than at the trough of a bear market. Since we believe that it is this market psychology that drives prices, we worry about how much greater the optimism can get in the unlikely event that a new bull market was truly emerging.
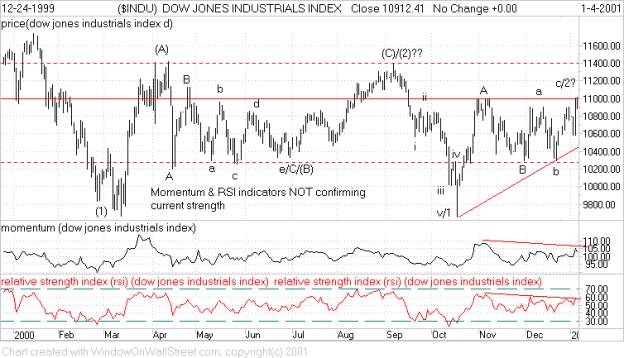
While sudden and abrupt, our bearish Elliott Wave interpretation has not changed much. We still think that the Dow is within a broad consolidation of its recent selling, and that the bear will soon re-emerge as the shock from the Fed and the sharp reaction wears off. If our labeling is correct, we should be finishing intermediate degree wave "2" now. A downturn would have the potential within intermediate "3" to retest and break below the most recent low near 10,300. Initial support still begins at 10,600, with key Dow support at 10,330 - 10,292. A close below this would still confirm that the next leg of decline was accelerating, greatly increasing the odds that a test of the 9654 was forthcoming. Prices have so far been testing higher sighted resistance at 11000, with more layered at 11,100, 11,250 and 11,400-25. A close above 11,450 would indicate a more complex rally was developing, and with the now higher Transports, a new Dow Theory BUY signal.
Notice that the lower Momentum and RSI indicators are below where they were at the November high, failing to confirm the Dow’s new trading high. At the very least, these bearish divergences show diminishing strength into the rally, often a prelude to a downturn. Keep it in mind that Wednesday’s sharp gains were NOT the beginning of a rally, but do have the potential to be the end of it, as they usually do end with such celebration of an anticipated event. While the Fed surprised the market in the delivery, the rate cuts were NOT the surprise! Also, notice where the upper intermediate term resistance line is drawn. This is the level that needs to be overcome before we can conclude a new Dow Theory buy signal!
To receive a sample copy, email us your request at: mtr@fuse.net. Please include your name, address, phone and of course your email address.
TREASURIES
Treasury yields have not made new progress on the Fed’s action and have indeed backed off from the gains that were reached in anticipation of the rate cut. The yield moved as low as 5.35% before briefly reversing back above 5.50%. Here, the markets sold the news as much of the money that had come into bonds ahead of the Fed quickly shifted back to equities, helping fuel those gains. Here too, our take is that the rally is ending now and vulnerable to a reversal of the intermediate bullish trend. Old resistance at 5.48-50% is now very short term support. A clear break above this level would put the rally in question, but a rise above 5.65% is now needed to generate a longer term sell alert on our P&F yield chart.
The Fed seems more concerned with the economy than with the potential for igniting higher inflation, a lower dollar, and the withdrawal of foreign funds from our markets. It very well could be a repatriation of this foreign capital that becomes an overwhelming issue that can potentially drive the bond yield much higher. As stated last Friday, we still regard the risk too great to justify the potential returns that bonds currently yield. Next resistance is near 5.375-.35%, 5.25%, and then 5.00%. Initial support is at 5.50%, 5.65%, 5.725%, 5.85%, and 5.925%. We remain neutral until we see more immediately compelling signs to become bearish. We report more specifically on these in the Reality Check Newsletter each month.
GOLD
Gold & the XAU have continued to disappoint after showing initial signs of recovery. While we think that if our forecast for the US Dollar, bonds and stocks come anywhere close this year, the desire to own gold and gold stocks will materialize. It has been close to two years since the last significant rally began, and while another push lower may occur, we think this area remains very appealing, under owned, and that their contempt is so great that their potential cannot be ignored. This least exploited of any asset class is just as likely to become exploited as was the case before prices soared from depressed levels in energy, utilities, and lately the Transports. In recent years, investors have latched on to a theme, driving it to great extremes before giving up on it. We see no reason why gold should not have its turn as the crowd searches for the next investment theme.
Initial support was raised slightly to 47 from 45, with the 41.64 low now key, and between 40 - 37, should the low fail to hold. A push to 54 on our(2 X 3) P&F chart has come close, but is still needed for a longer term "Low Pole" (LP) buy alert. A rally above the 55-6 level of resistance would confirm that the short term trend has turned bullish. Higher resistance is at 59, then at 64, and 69.
PORTFOLIO CHANGES
Friday, January 5, 2001: 1/2/01: Coca Cola Femsa (KOF) short hit the 23 top (-19.48%); We replaced it with new shorts 1/2/01: another try on Fannie Mae (FNM) at 84 5/8 after a second buying climax (BC) and high pole @ bearish resistance (HPBr) shorting formation. It has since broke its uptrend line, but got a strong BUY recommendation this morning. Perhaps this will allow for new positions closer to our stop loss point, which we will use at 82; 1/3/01: Nortel (NT) 33 � was added to our large cap portfolio. We think this is a great value + growth issue in the telecom sector. We are also looking seriously at Lucent (LU), Three Com (COMS), Novell (NOVL) and others with great balance sheets little debt, lots of cash and strong recovery prospects. 1/4/01: Procter & Gamble (PG) 73 � as it showed a high pole top, has bearish relative strength and lots of insider selling; 1/4/01: We recommended selling the Fluor spin off of Massey Energy (MEE) at 12 3/8, adjusting lower our cost basis for the new FLR stock 1 for 1 (the gain or loss will be calculated from the future sale of FLR). [Part of our offensive is to have a good defense! That means limiting losses and protecting gains]!
Article contributed by Mitch Harris: President, Market Trend Realities & Editor,
The Reality Check Newsletter, and reprinted here with permission.
Market Trend Realities (MTR) is a Registered Investment Advisory which manages personal, corporate, Trust, and retirement accounts on a fee only basis. Several low cost, flexible management fee arrangements are available. Investment Advisor, Mitch Harris has studied the Point & Figure Charting Method under the direct supervision of Michael Burke, Editor of the prestigious Investors Intelligence research organization. Management is based on a unique combination of technical analysis methods and tools which include, The Point & Figure charting method, Elliott Wave Analysis & techniques, industry group analysis, cycle analysis, Relative Strength Analysis, Stochastics, and investor sentiment studies. MTR offers a very uniquely structured managed mutual fund program using the RYDEX family of mutual funds, which offer outperformance potential whether equity markets are rising OR falling! Inquiries are welcome by calling us at
(513) 421-8737,
Fax: (513) 421-8733 , or by email at: mtr@fuse.net .
MTR also publishes a monthly investment newsletter called "Reality Check", which offers technical commentary on the stock & bond markets, the Dollar Index, gold & gold stocks (XAU), Treasury yields, utilities, investor sentiment, and Federal Reserve policy. It also offers stock trading recommendations each month with price targets, stop loss points and insider activity. There are 4 trading portfolios, including a short selling account (we are very proud that our short sale recommendations have averaged 12.5% "compounded" during the roaring bull market of the last 5 years). Short term market commentaries are updated on Tuesday and Friday mornings, along with portfolio changes on this web page. They are also emailed for free to anyone who provides us with their email address. The regular subscription rate is $200 (US) per year. Samples are available upon request. MTR will be happy to send information on any of the above mentioned services. Please email us your home or business address along with your daytime phone number and specify your interest(s).
Copyright � 1998-2002 Tulips and Bears LLC.
All Rights Reserved. Republication of this material,
including posting to message boards or news groups,
without the prior written consent of Tulips and Bears LLC
is strictly prohibited. 'Tulips and Bears' is a registered trademark of
Tulips and Bears LLC
Last modified: April 01, 2001
Published By Tulips and Bears
LLC