|
Home
Up
Co-brand
Partnerships


| |
|
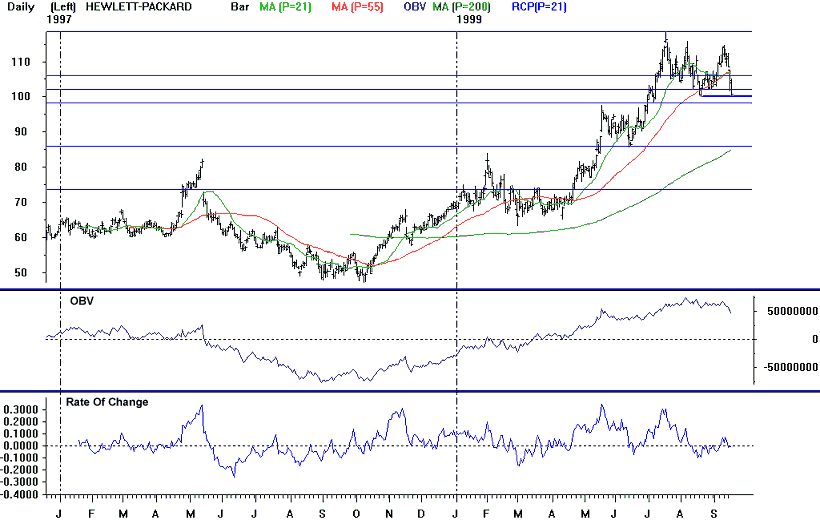
9/20/99 Hewlett Packard (HWP)
Points to watch: Since peaking
in mid July, HWP has attempted to runs at its old highs, each peaking at a
lower high than the previous rally. The stock fell below its 55 day
moving average (107.16) during Thursday's market selloff for the first
time since April. On Friday, the stock tested support at 100 intraday
before closing the day at 100.81. Technical indicators continue to
deteriorate, suggesting the stock's decline has further to go. Daily
OBV turned down in September, weekly RSI turned down in mid July, and both
daily and weekly RSI showed strong negative divergences with price during
the September rally attempt. A strong sell signal would be given on
a break below the August 10th low of 100.
|

DISCLAIMER
|
