|
Home
Up
Co-brand
Partnerships


| |
| 4/5/99 Walgreen Co(WAG)
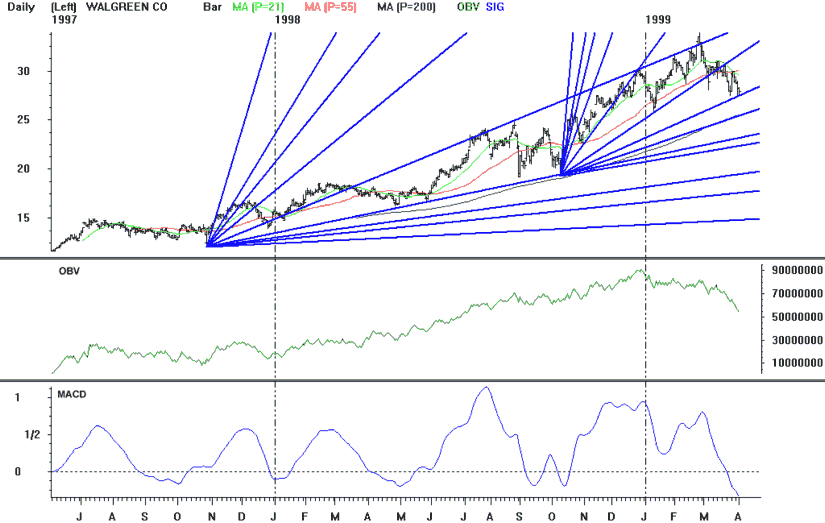
Points to watch: Walgreen peaked on 2/24 at 33
15/16. The stock' rally was stopped by the Gann 1x1 angle which had stopped previous
rallies in July, August, and December 1998. WAG has since crossed below both its
21day (29.53) and 55 day (30.05) moving averages. Daily OBV topped in December and
showed a strong negative divergence with price at the February peak. Weekly MACD and
stochastics gave sell signals on 2/26, and daily MACD gave a sell signal on 3/22.
The stock held Gann support at 27.5 intraday. Additional support exists at
26.82 (the 25% retracement of the 7/94-2/99 rally). Wait for a break below 26.8
before selling or shorting Walgreen.
|

|
