Veritas
Software Corp (NASDAQ: VRTS)
Market Call™ for November 21, 2000
Contributed by Mark Seleznov, TrendTrader.com.
The purpose of this Market Call section is to
educate readers in technical analysis patterns and indicators. As with all investment
information, you need to research information and consult your financial advisor before
initiating any strategies that are contained in Market Call.
Also, you must realize that as with all trading strategies,
opinions can change quickly depending on market conditions and developments.
This column tries to present historical examples, potential set
ups, and examples of entry and exit strategies.
When looking for short sale candidates, many are looking at strong stocks
that they believe is too high.
I feel that it is easier to find short candidates that are weak and have
dropping.
A rally may be a true up trend or just a small rally in a much larger down
trend.
By looking at weak stocks and combining moving average failures, can produce
profitable results.
Drawing Trendlines in a Support and
Resistance Channel
Support and resistance can take many shapes. Sometimes it is a horizontal
line across support and many times it takes the shapes an angled channel.
The drawing of the trendlines is basically the same. You draw them across
the bottom support. Many times you will find the resistance trendline as a
parallel line.
It is a good idea for a trader to be drawing trendlines on their charts to
help them visualize these support and resistance areas. The chart below
does not have trendlines drawn on them. You should print them out and draw
your own.
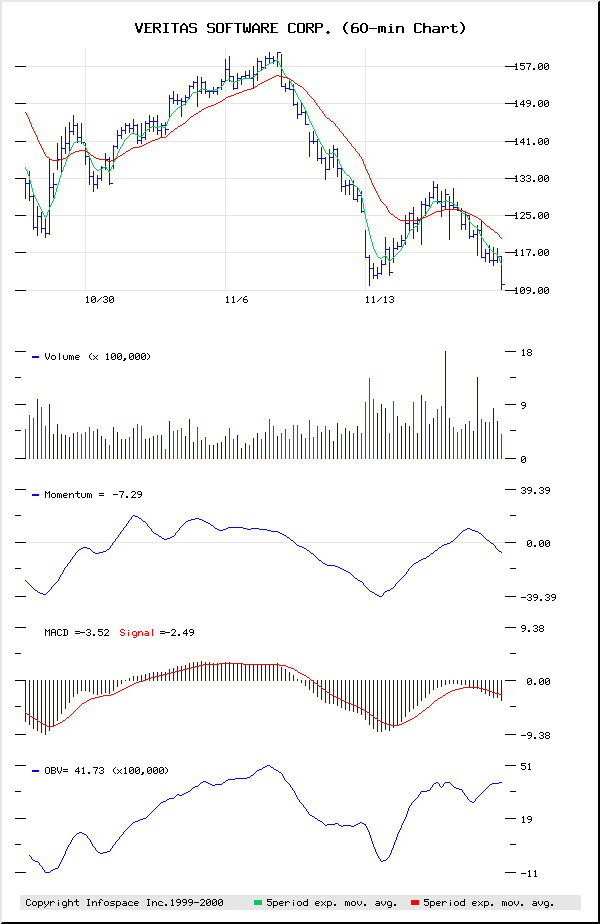
Print out this chart and let’s draw
these trendlines on Veritas Software
By looking at he chart below, a trader would draw a Support trendline across
the recent support at 110 which occurred November 13. Resistance can be
drawn across short-term resistance at 130.
Today, November 20, 2000, VRTS broke this support of 110 late in the day in
the last hour of trading.
This would have been the ideal entry point.
A short taken just below 110 and a stop at 116, would have been the trade.
It still may not be too late to short VRTS if a morning bounce takes it back
to the 110 area and a stop of 3 % used.
Unfortunately, for longs, many stocks look like VRTS.
Always use stops in your trading.
We are also very oversold, and stops need to be placed on shorts just as
they are on long positions.
Chart courtesy of
Interested in adding Market Call to
your website?
Click here for details: Market
Call Information
Mark A. Seleznov is a General
Securities Principal and Managing Partner of Trend Trader, LLC, a NASD, SIPC broker/dealer firm located in
Scottsdale, Arizona. A professional trader for over 25 years, Mark was a Market Maker on
the Philadelphia Stock Exchange, a Retail Registered Representative, and futures trader.
Mark is an author and recognized expert in equity Day Trading. He conducts seminars in
Equity Day Trading and offers his firm traders training and support. If his firm holds any
positions in the public companies he writes about, it will be noted at the bottom of his
article.
Market Calls is a daily syndicated column on trading by Mark A. Seleznov, Managing Partner
of Trend Trader,
LLC. For information on obtaining Market Calls for your web site,
newspapers, or publication, contact Trend Trader, LLC at 602-948-1146
Disclaimer: Trading in securities may not be suitable for
all individuals. Consult your broker or other professional to determine your suitability.
This is not an offer to buy or sell securities. The advice given above is of a general
nature and should not be taken as a recommendation to buy or sell the referenced security.
Copyright �
1998-2000 Tulips and Bears LLC.
All Rights Reserved. Republication of this material,
including posting to message boards or news groups,
without the prior written consent of Tulips and Bears LLC
is strictly prohibited.
Last modified: November 21, 2000
Published By Tulips and Bears
LLC