COR
Therapeutics (NASDAQ: CORR)
Market Call™ for November 29, 2000
Contributed by Mark Seleznov, TrendTrader.com.
The purpose of this Market Call section is to
educate readers in technical analysis patterns and indicators. As with all investment
information, you need to research information and consult your financial advisor before
initiating any strategies that are contained in Market Call.
Also, you must realize that as with all trading strategies,
opinions can change quickly depending on market conditions and developments.
This column tries to present historical examples, potential set
ups, and examples of entry and exit strategies.
The moving average crossover method is one of the oldest technical analysis
techniques used in trading. There is not exactly one combination of periods
that a trader might use. We use a 5 and 20 EMA in this column.
What is more important is what happens on a signal. I like to call it
trading on expectations. If a stock is truly reversing direction, the stock
should move up sharply after crossing the longer moving average. If the
stock fails at this longer moving average, the average is just resistance as
the stock keeps moving lower with the Sell Short signals working, while each
long signal fails at the moving average.
Moving Average Crossovers
Moving averages are one of the oldest and most popular technical analysis
tools.
A moving average is the average price of a security at a given time. When
calculating a moving average, you specify the time span to calculate the
average price for X number of periods. For example, 20 periods. These
periods may be 5 minute bars, 15 minute bars, 60 minute or daily bars).
The classic interpretation of a moving average is to use it to observe
changes in prices. Investors typically buy when a security's price rises
above its moving average and sell when the price falls below its moving
average.
The moving average crossover method calculates two moving averages, each
based on a different number of periods of trading data. When the
shorter-term (fewer days) average crosses above the longer-term average from
below, this is a buy signal for tomorrow's open. When the shorter-term
average crosses below the longer-term average from above, this is a sell
signal for tomorrow's open.
The current charts we are using calculate a 5-period and a 20-period
exponential MA of the closing prices on 60 minute bars. If the 5-period MA
crosses above (becomes greater than) the 20-period MA, you would buy the
next bars opening because the system is saying that an uptrend has begun.
You maintain this long position as long as the 5-period MA is greater than
the 20-period MA. When the 5-period MA crosses below the 20-period MA, the
trend is now down and you would liquidate your long position and establish a
new short position on the next bars open.
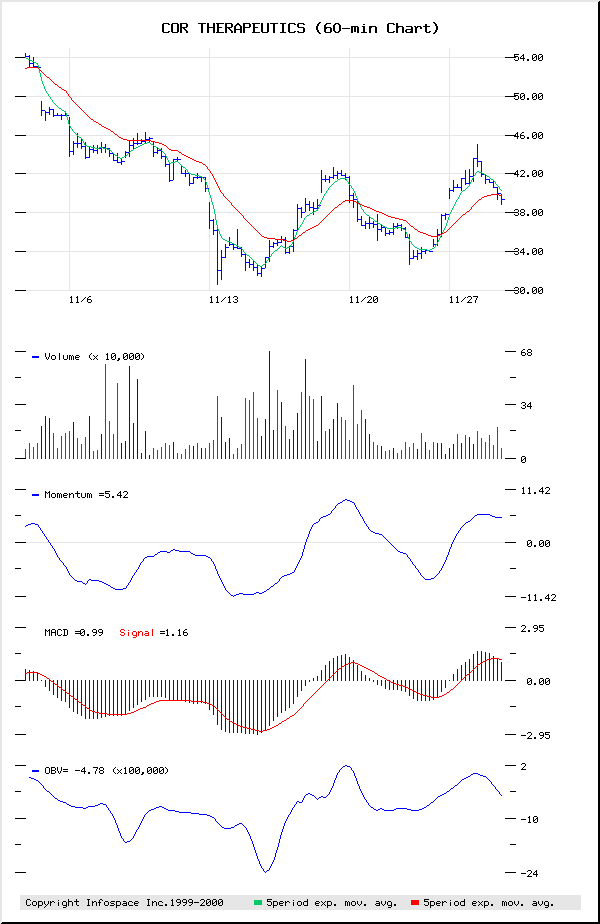
COR Therapeutics (NASDAQ:
CORR)
After a recent decline, CORR had a moving average Buy signal on November
24 and moved up from 36 to 45 as a moving average Buy signal would be
expected.
Today, November 28, 2000, CORR reversed and has now flashed a Sell signal.
I would exit the long trade as this time.
An aggressive trader may want to short CORR here at 39.
If shorted here, I would place a stop at 41 �.
The expectation is that CORR will drop from here, just as it went up from
36.
Chart courtesy of
Interested in adding Market Call to
your website?
Click here for details: Market
Call Information
Mark A. Seleznov is a General
Securities Principal and Managing Partner of Trend Trader, LLC, a NASD, SIPC broker/dealer firm located in
Scottsdale, Arizona. A professional trader for over 25 years, Mark was a Market Maker on
the Philadelphia Stock Exchange, a Retail Registered Representative, and futures trader.
Mark is an author and recognized expert in equity Day Trading. He conducts seminars in
Equity Day Trading and offers his firm traders training and support. If his firm holds any
positions in the public companies he writes about, it will be noted at the bottom of his
article.
Market Calls is a daily syndicated column on trading by Mark A. Seleznov, Managing Partner
of Trend Trader,
LLC. For information on obtaining Market Calls for your web site,
newspapers, or publication, contact Trend Trader, LLC at 602-948-1146
Disclaimer: Trading in securities may not be suitable for
all individuals. Consult your broker or other professional to determine your suitability.
This is not an offer to buy or sell securities. The advice given above is of a general
nature and should not be taken as a recommendation to buy or sell the referenced security.
Copyright �
1998-2000 Tulips and Bears LLC.
All Rights Reserved. Republication of this material,
including posting to message boards or news groups,
without the prior written consent of Tulips and Bears LLC
is strictly prohibited.
Last modified: November 29, 2000
Published By Tulips and Bears
LLC